ColorTools is a Python library and command-line tool that can compute the dominant colors of an image. This enables several different ways to automatically sort the images, including sorting by hue.
While there are many approaches one can use to order the images in a collection (subject matter, season, date, composition, aspect ratio, etc.), some of my favorite photographers sort collections of images by color (or at least heavily factor color into the sequencing of their collections). I’ve always found the results of this approach logical and aesthetically pleasing. When viewing the collection at a distance, it conveys a calm sense of order to my eye.
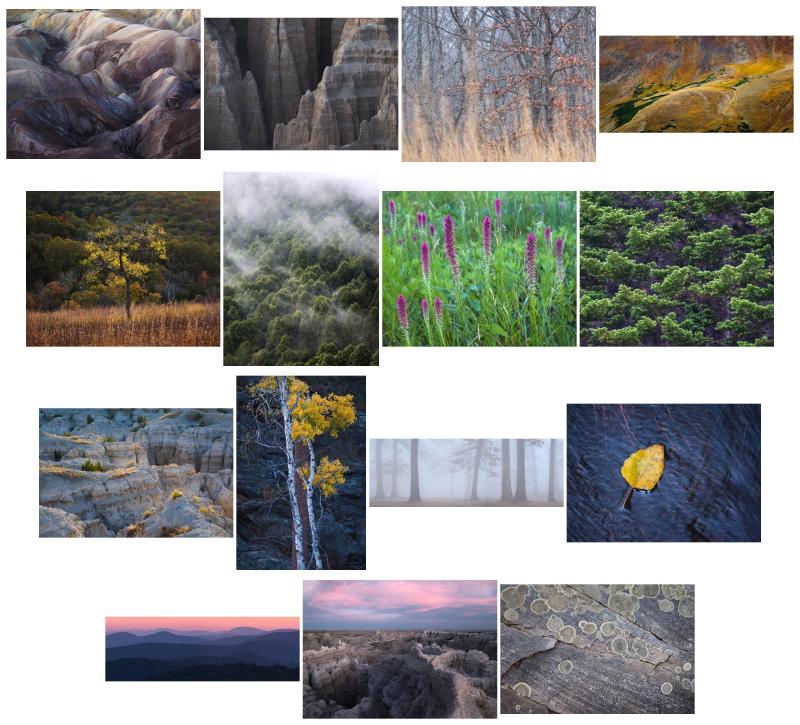
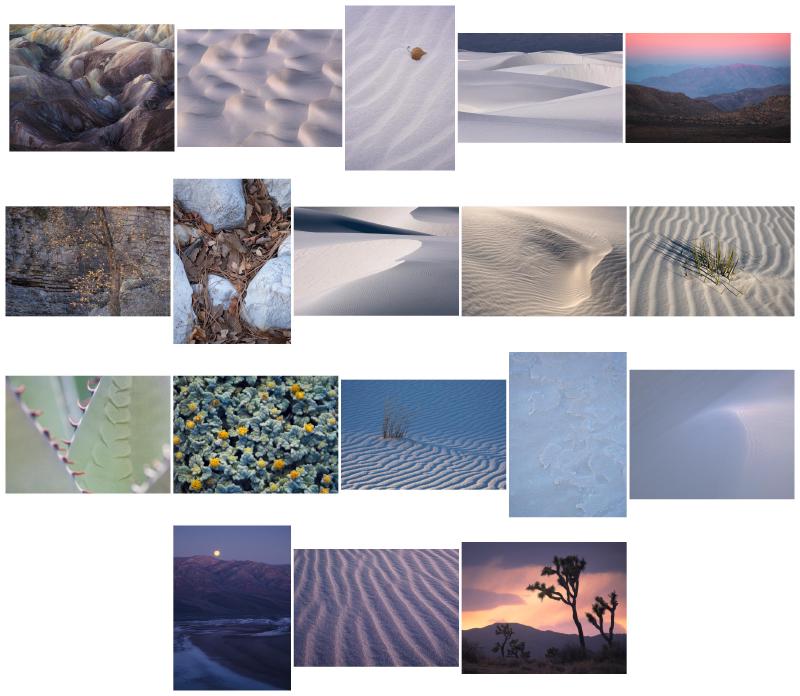
Of course, images can be sorted by color manually, and if a collection of images is not too large, it isn’t too difficult to do. However, ColorTools provides a way to do it automatically and objectively.
In this article, I will highlight some of my reasons for building ColorTools, discuss how it works, and share some ideas I have about improving it in the future. As always, I’ve tried to include lots of links to external resources for curious readers.
But Why?#
The first question I often get after describing this tool to someone is some variation of why? Don’t you know that you can do that in Photoshop? Don’t you know that you can use ___ to do that?
It’s true: there are existing tools that will compute the dominant colors of an image. Among them are Adobe Color, as well as Photoshop’s average blur and indexed color mode. I also know that various filters such as Cutout and Poster Edges can be used for similar purposes.
That said, I can think of at least two good reasons to create my own tool for this purpose: (1) it gives me a much greater level of control, both over how the tool is implemented (which algorithm is used to extract colors) and how the tool is used (the broader workflows that employ the tool), and (2) it gives me a way to scratch the itch of curiosity and learn more about the problem firsthand!
How It Works#
My first thought for computing the dominant color of an image was to use the average. If you spend a few minutes trying out the average blur tool in Photoshop, you’ll quickly find that this doesn’t achieve the desired outcome: the resulting color is usually some shade of dull gray or brown. Not quite what I was looking for!
With my naïve idea out of the way, I started digging around to see if anyone had solved this problem in Python before, and of course, many people had.
Before going further, I should note that the next few sections might get a bit technical. I encourage you to take a look, but if this isn’t your thing, feel free to skip to the On to the Cool Stuff section below.
K-Means Clustering#
Two implementations I encountered early on (Finding Dominant Colour on an Image and Finding the dominant colors of an image) both used a machine learning method called k-means clustering to solve the problem of computing dominant colors. These examples served as the starting point for ColorTools. Both are noted in the references document of my codebase and within the code itself.
To understand how k-means clustering can be used to compute the dominant colors of an image, we need to remember that digital photographs themselves are just data. Each pixel is a data point with three values: one for red (R), one for green (G), and one for blue (B). Together, these three values comprise a color. For instance, the RGB triple (138, 43, 226) has a red value of 138, a green value of 43, and a blue value of 226. This particular triple represents a nice shade of violet.
Consequently, a single image can be represented as a huge list of RGB triples, one for each pixel in the image. So a 26.1 MP image has 26,100,000 such triples. That’s quite a bit of data!
Now, back to k-means clustering, our machine learning algorithm. The name k-means clustering gives us some hints about how it works:
k-means: Here, k is just a variable for the number of means or averages in the result. This value must be provided to the algorithm, i.e. the decision about the number of averages to compute is determined externally.
clustering: Broadly speaking, clustering is a machine learning approach in which data points are grouped according to some similarity metric. Two data points that are similar would be grouped into the same cluster, whereas a third data point that is dissimilar might be grouped into a different cluster.
Putting it all together, k-means clustering seeks to find an optimal set of k averages within the data (by minimizing the within-cluster sum of squares, which I will not be saying any more about here), then labels the data based on similarity to those averages.
For instance, if k was set to three, then there are three resulting averages, and therefore three possible labels. The labels partition the data into the three resulting clusters. The average values themselves are the prototypical values for the computed clusters (and are also referred to as the cluster centroids), and if they are represented in RGB space, the end result is that the image can be reduced (or quantized) to just k or three colors.
Of course, this is a high-level view. If you’d like to read more, there’s no shortage of free resources online to do so! I found the following resources to be good starting points:
K-means entry in the scikit-learn documentation (scikit-learn is the Python library I use in ColorTools)
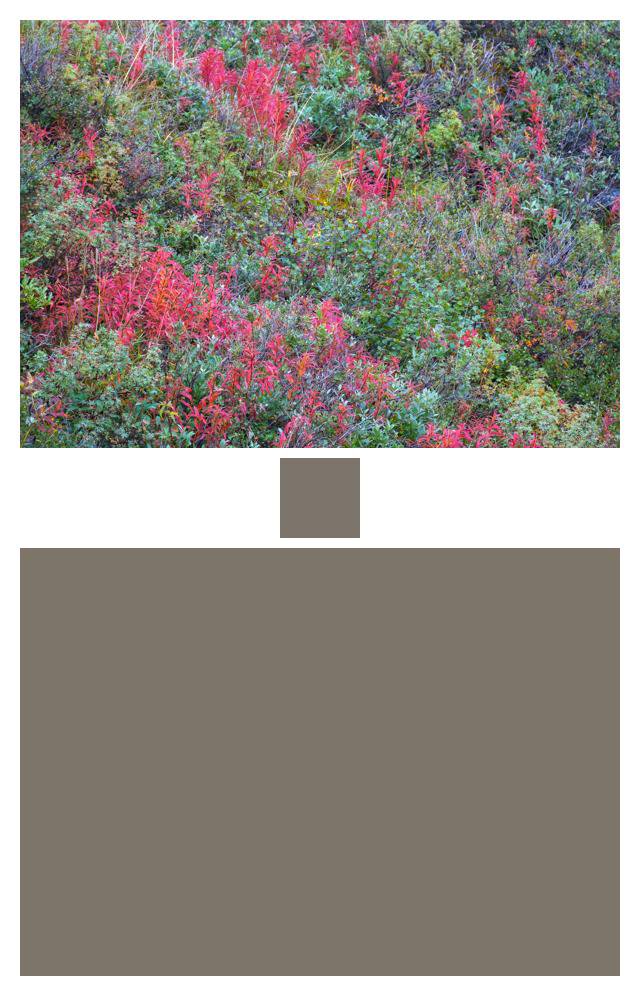
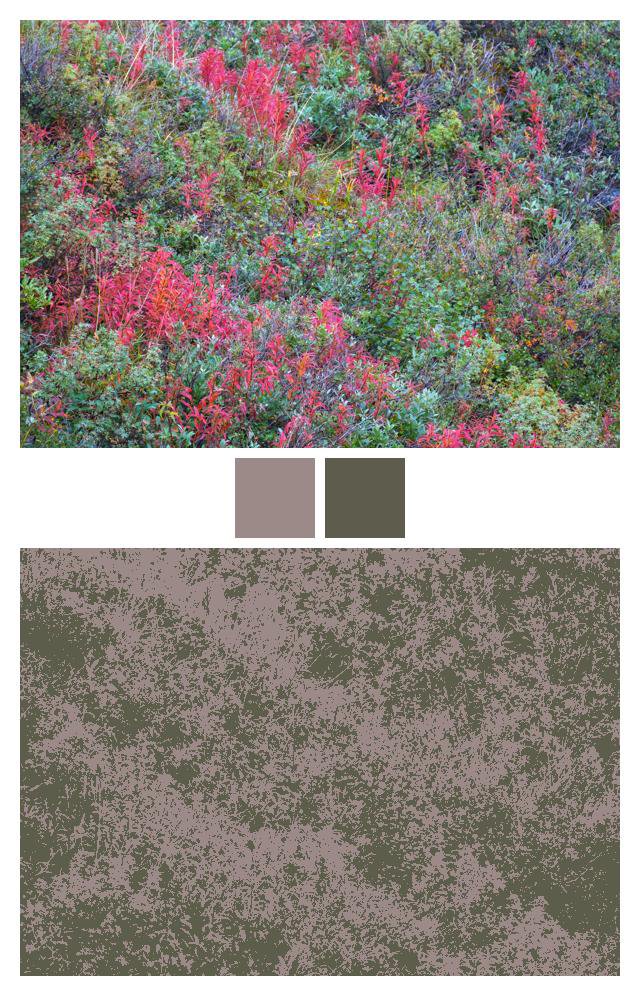
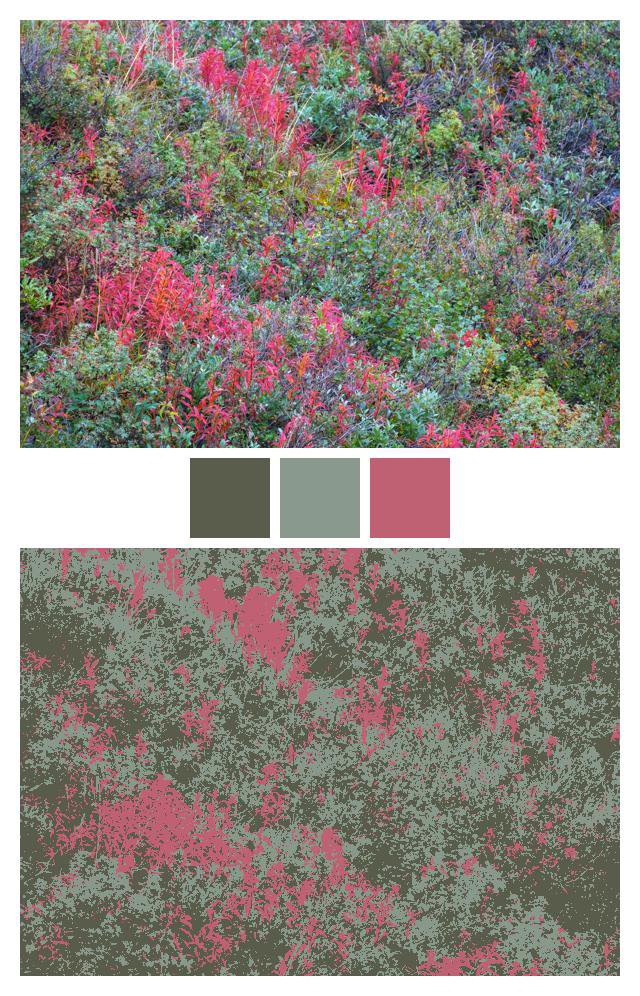
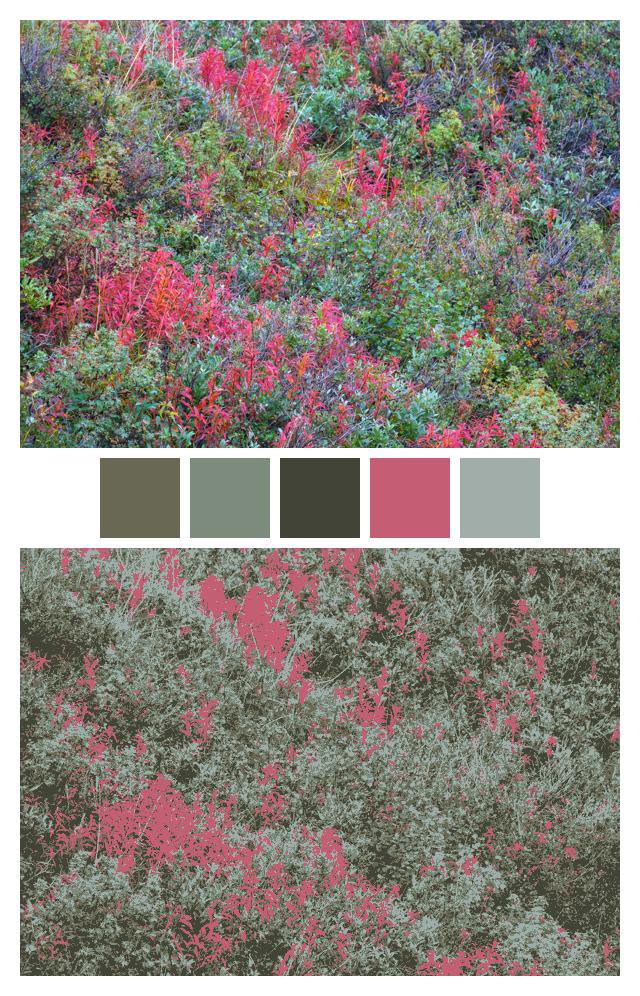
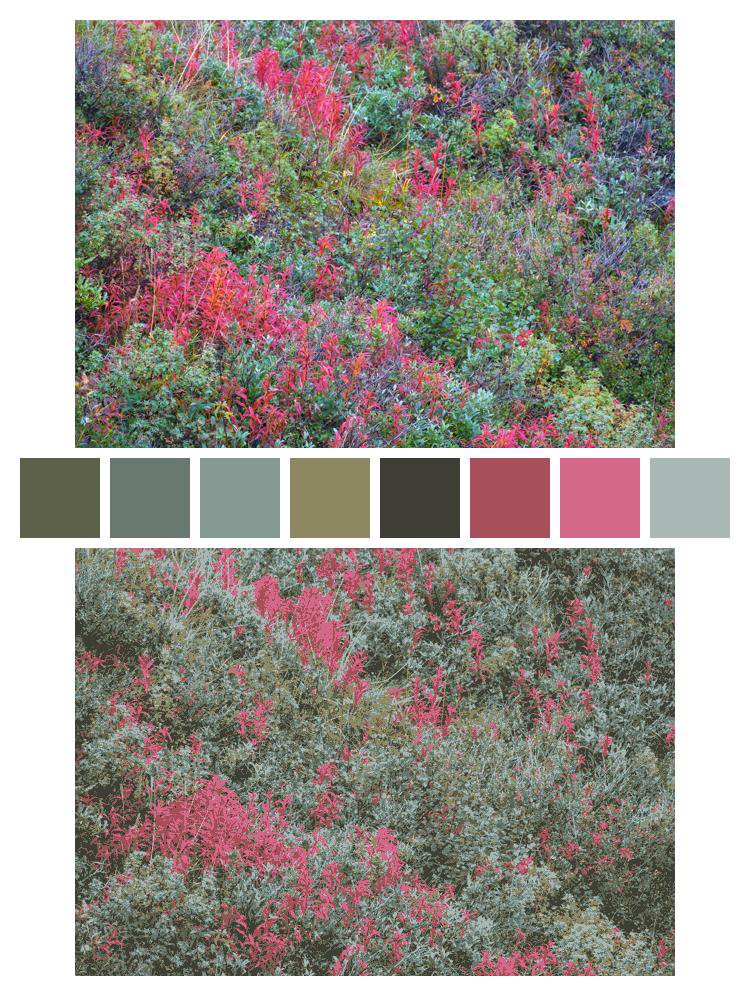
Below, you’ll see a colorful image from Denali National Park reduced to 1, 2, 3, 5, and 8 colors. When a single color is used, the result looks very much like what you might get if you used Photoshop’s blur average tool: k-means clustering with a k value of one finds a single average representing just one cluster for the entire image! As k increases and the images are partitioned into more and more colors, the image slowly begins to resemble its original appearance.
Setting K#
How do we know what value to set k to? Intuitively, k should be roughly equivalent to the number of dominant colors in an image. But this number varies widely: some images are mostly monochromatic, in which case it doesn’t make sense to try to compute more than two or three dominant colors. Other, more colorful images might have five or more obvious colors.
Unfortunately, there is no quick and easy way to set k automatically for each image. While there are some computational approaches that could be explored, they take a little longer to execute than I wanted for ColorTools, especially in use cases involving batch processing over dozens or hundreds of images. As a result, I decided to instead use a set of heuristics for quickly approximating a “good enough” value for k.
There are currently four different k-selection heuristics to choose from — all based generally on the idea of first computing a distribution of the hues in the image and then deriving a value from that distribution. Some derive k via the percentage of discrete hues represented in the image; others perform “binning” on the distribution in an attempt to group similar hues together and derive k from the binned distribution.
These heuristics can be viewed in detail in colortools/heuristics.py (perhaps confusingly, I renamed k to n in ColorTools, since early on I renamed the k parameter to n_colors to be clearer about its purpose… I’m not sure whether I achieved that goal). Note that they are still quite experimental in nature and one of the biggest areas of ColorTools to improve upon in the future.
Almost There#
To quickly recap: the output of the k-means clustering process is a set of labeled data where each pixel is a data point, and the label associated with each pixel is the cluster center (or computed average value) that is closest to it. The number of possible labels is equal to k or the number of clusters.
With this in mind, if we create a distribution of the labels from the labeled data, we will see that some labels have more pixels associated with them than others. While collectively the labels represent the set of dominant colors that was computed from the image, the label with the largest proportion of pixels after that distribution is computed represents the image’s single most dominant color. More precisely, that label is associated with a cluster center, which has a numerical (R, G, B) value, which in turn represents a color. Phew! ColorTools uses this top dominant color for the purpose of sorting and representing the image in summary graphics.
On to the Cool Stuff#
At long last, we finally have the image’s dominant colors! Or at least a rough estimate for them. Now we can do all kinds of interesting things.
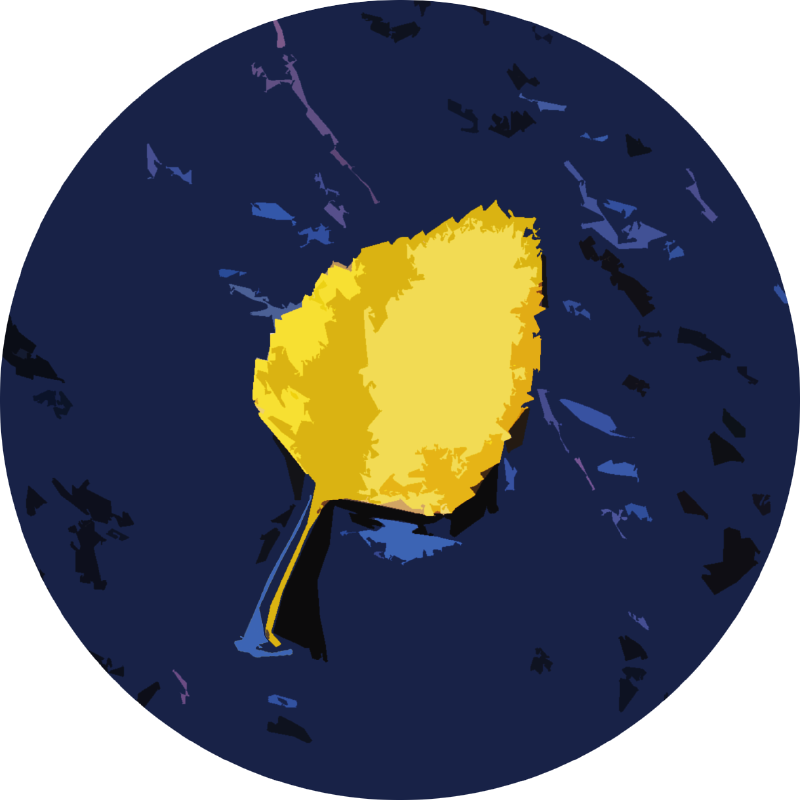
- We can re-generate the original image using only the dominant colors that were computed, where every pixel’s value is replaced by the value of its associated cluster color, in order to produce a color-reduced or “quantized” version of the image.
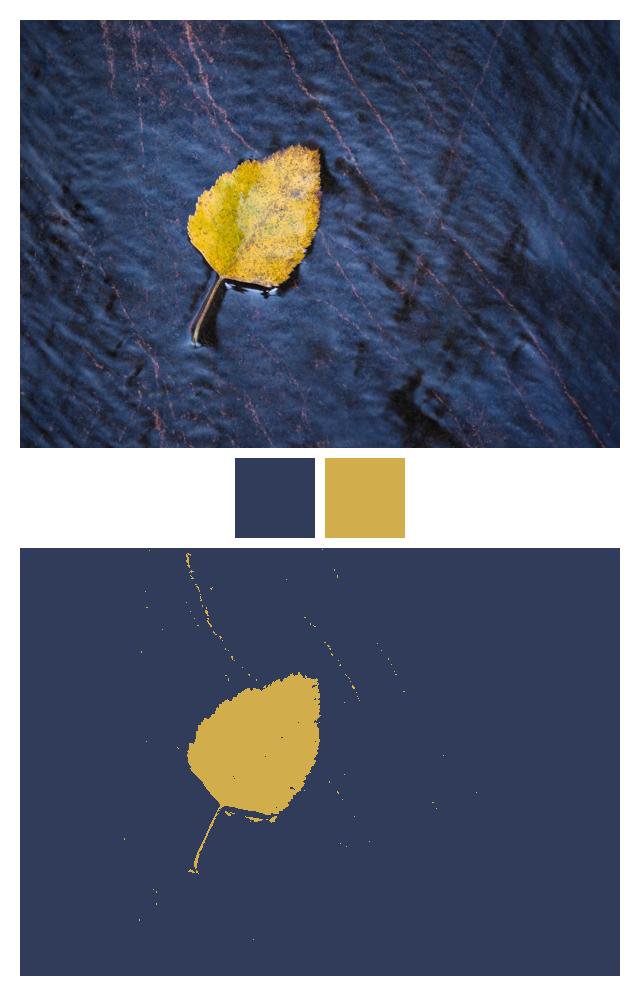
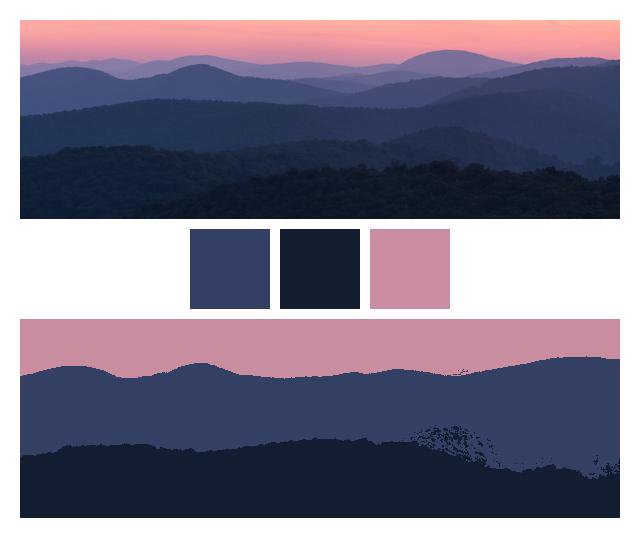
- We can compute the dominant colors of a set of images and generate a “spectrum” using the top dominant color of each image.

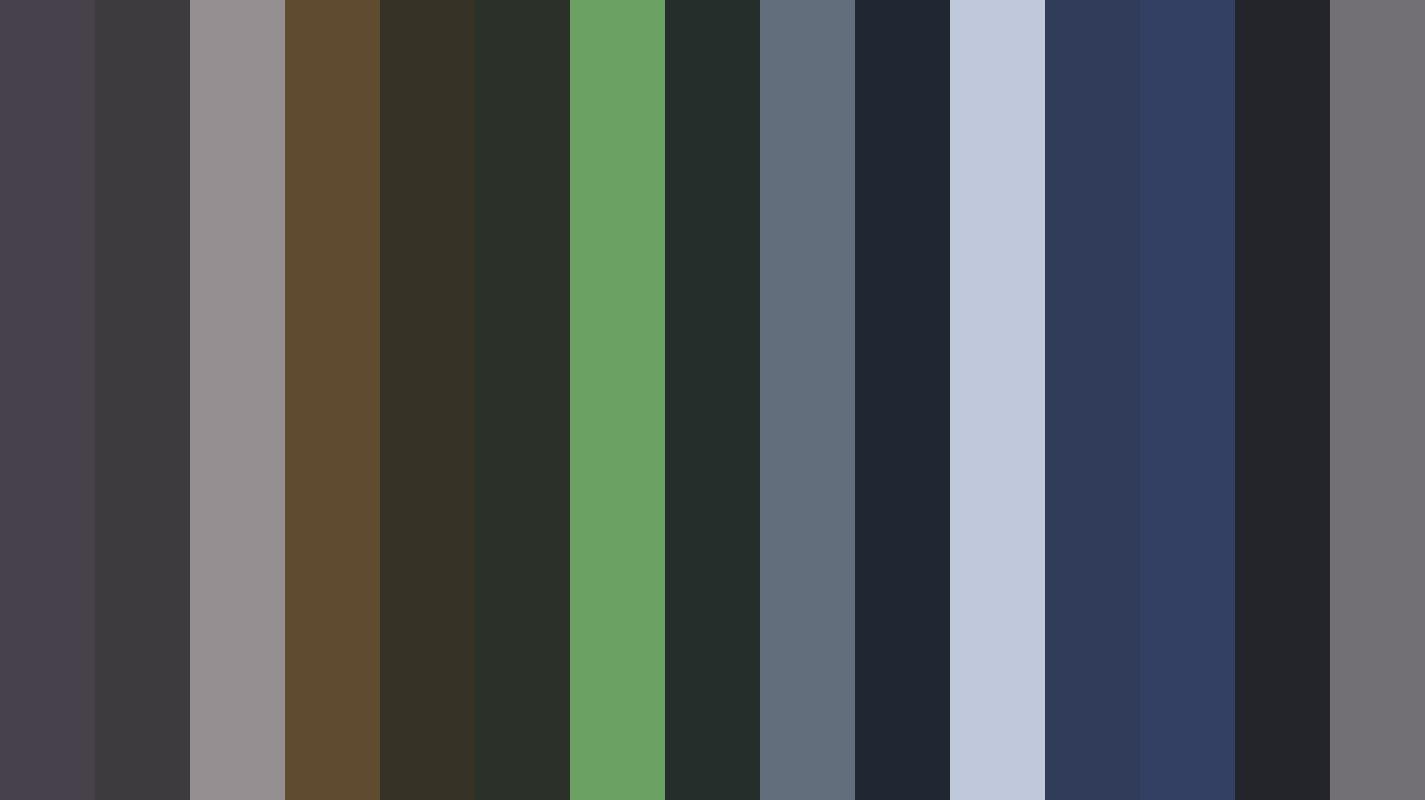
- So far, every graphic in this article has displayed a representation sorted by hue. In order to achieve this sort order, the computed RGB averages are transformed to the HSV (hue, saturation, value) color space, which also makes it straightforward to sort by the saturation or value of each image’s top dominant color.
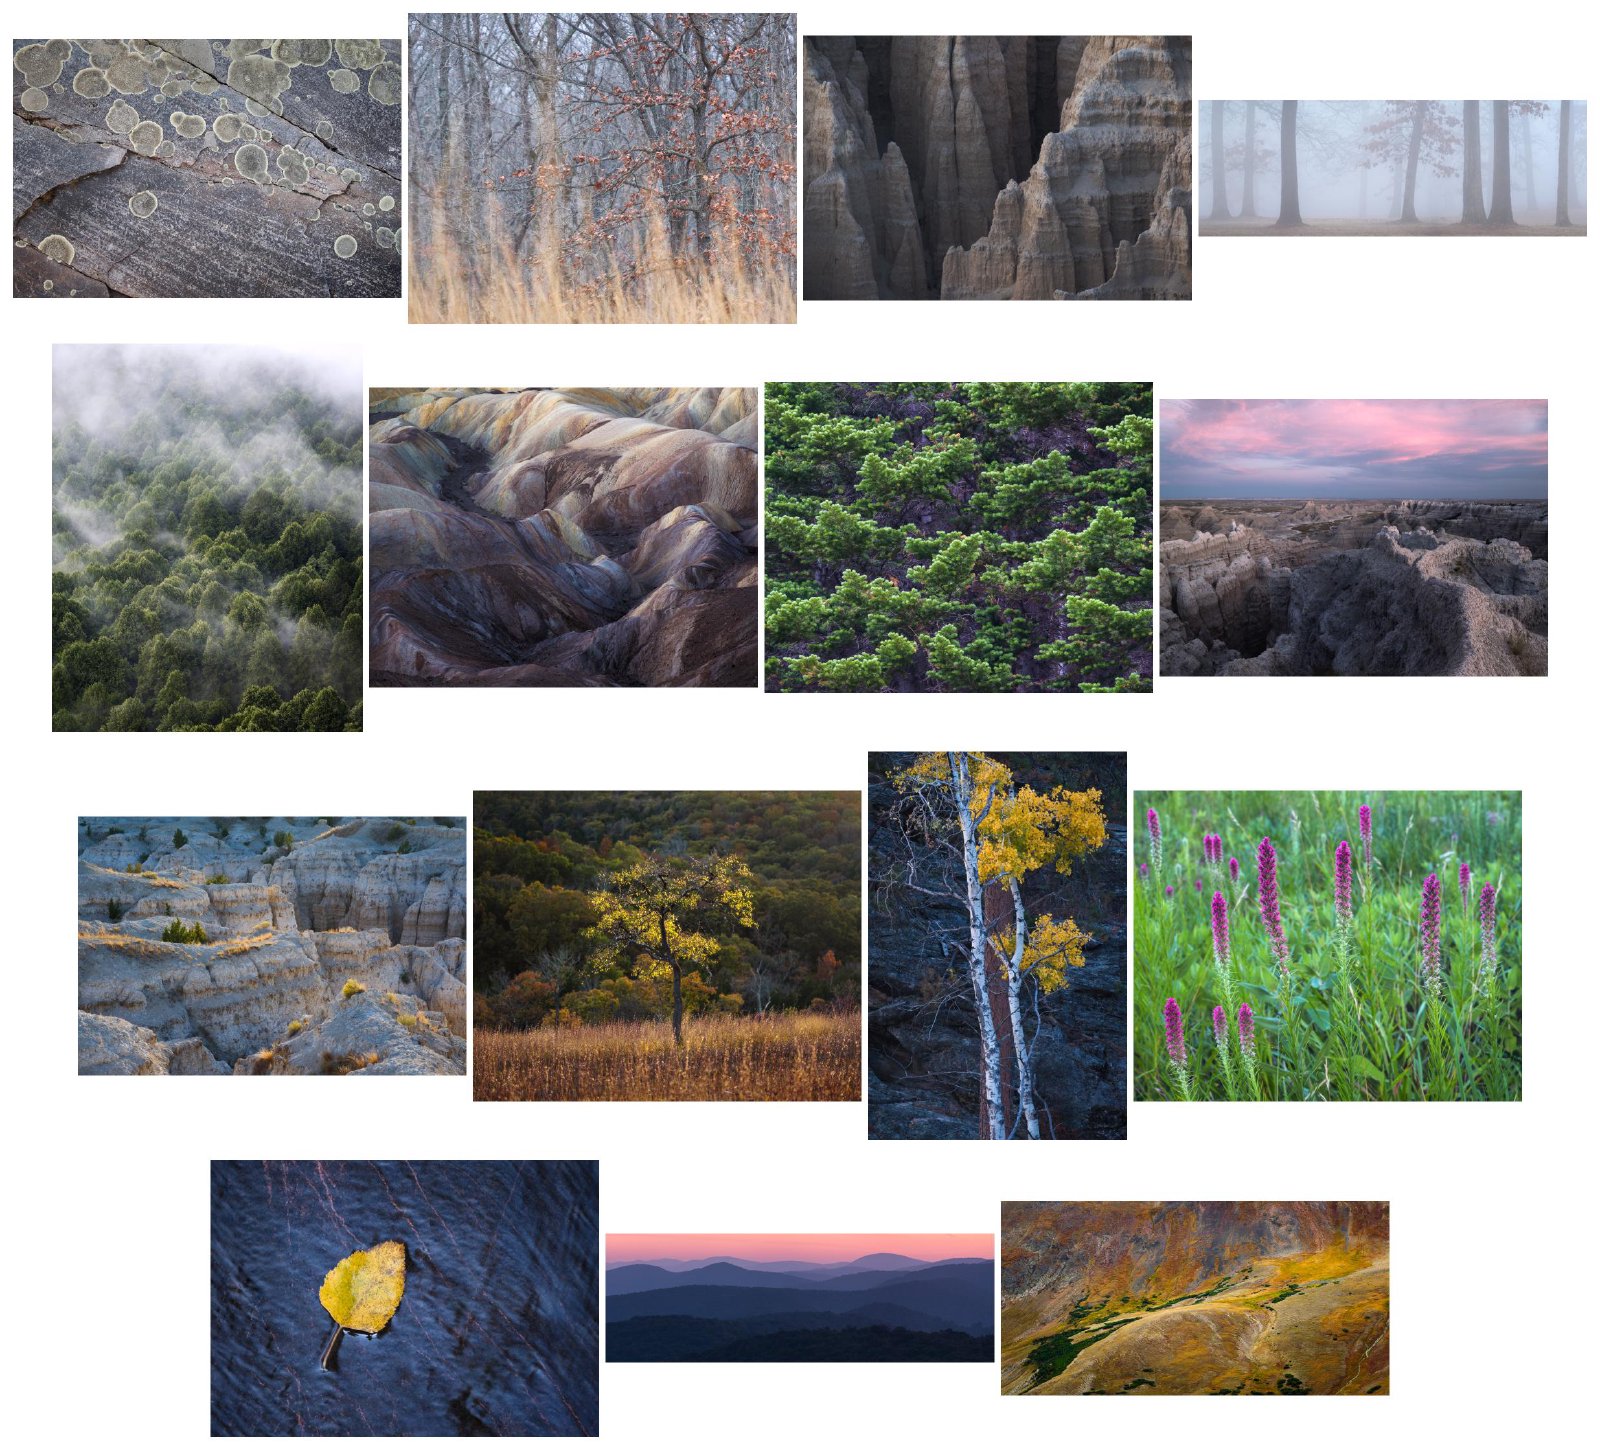

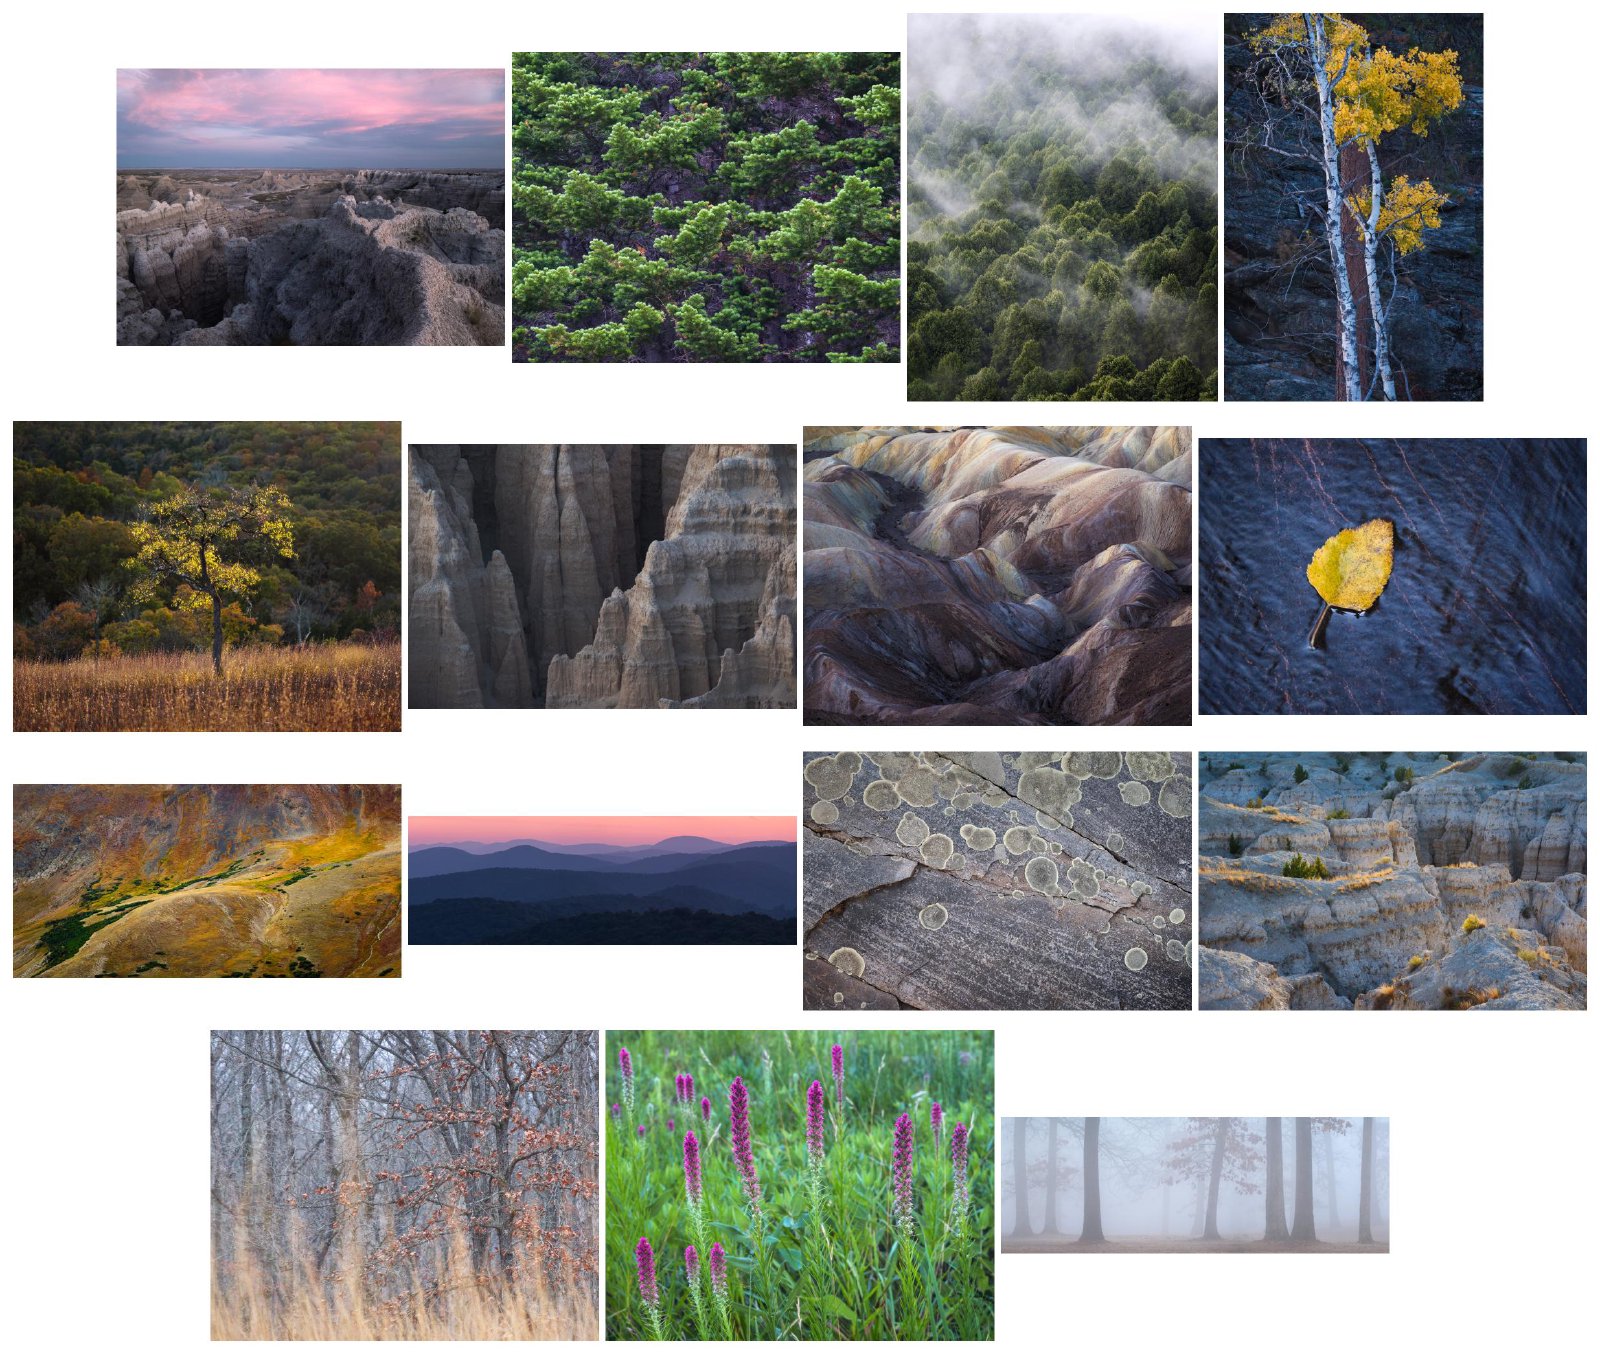

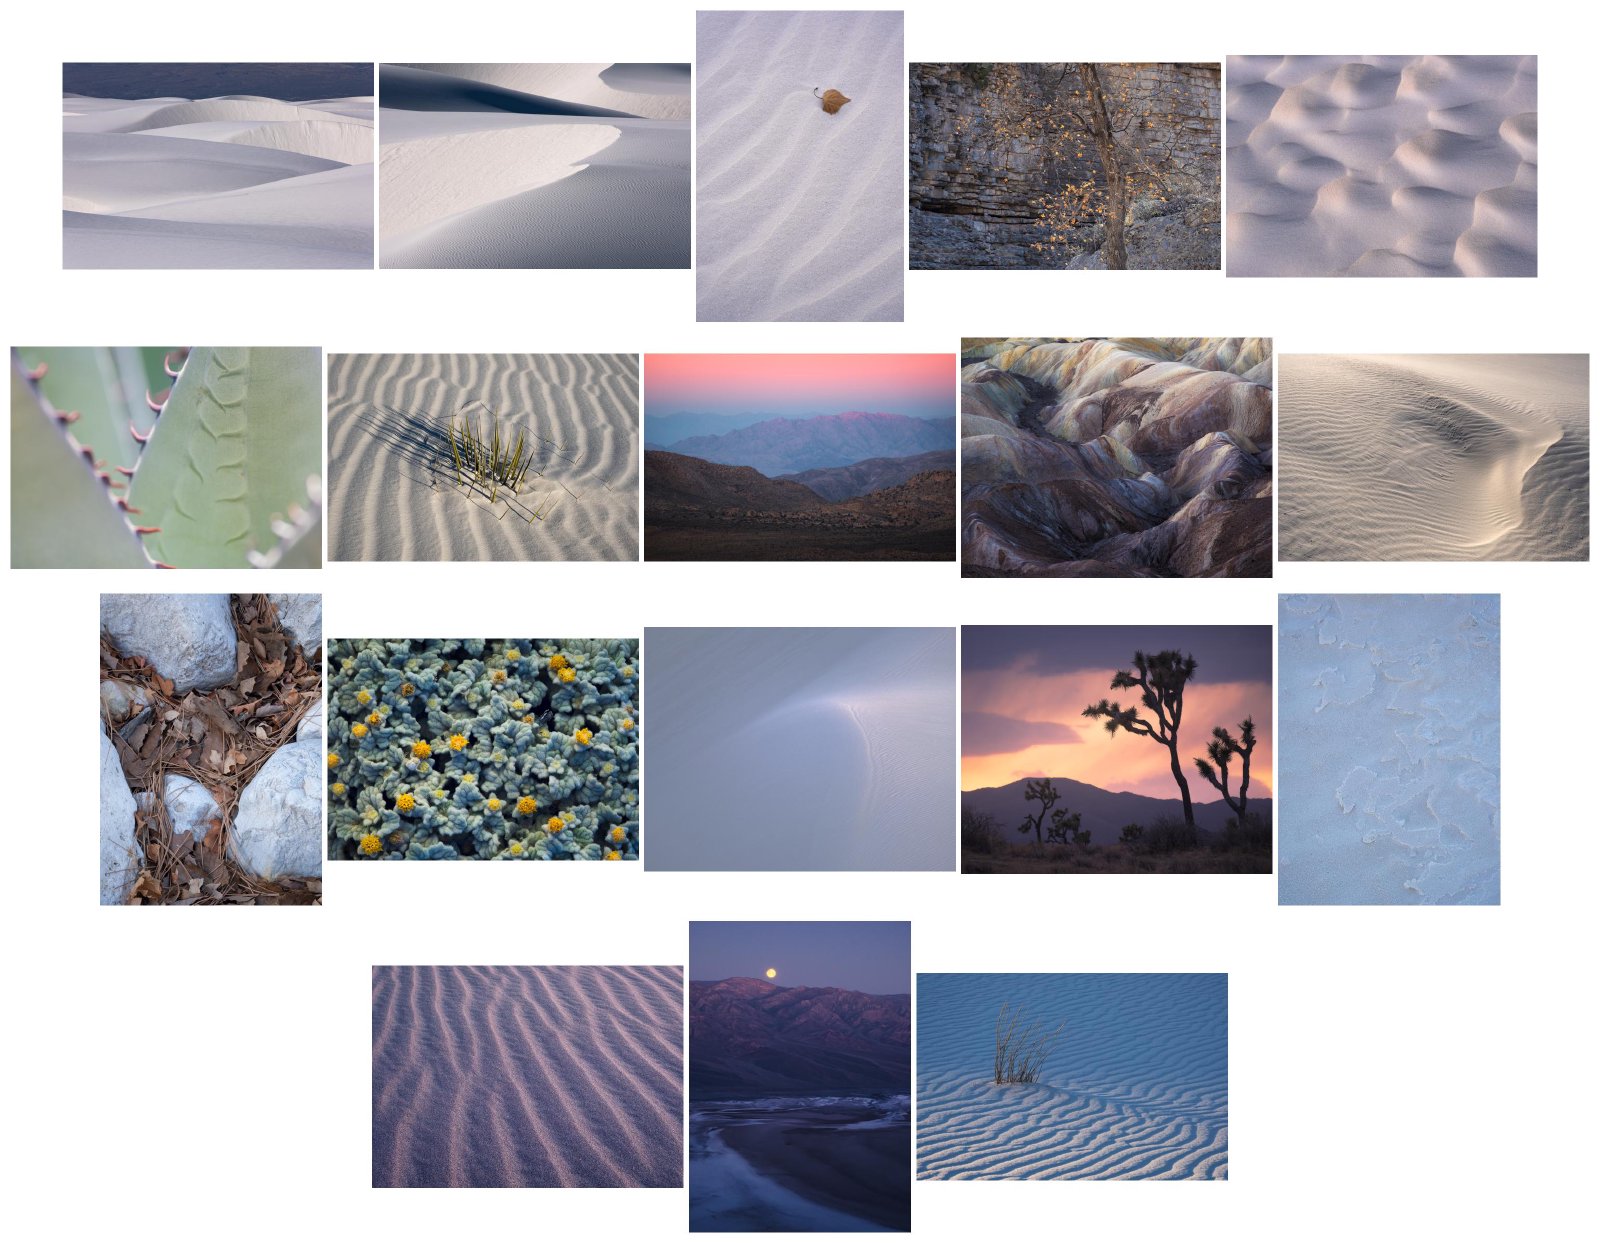

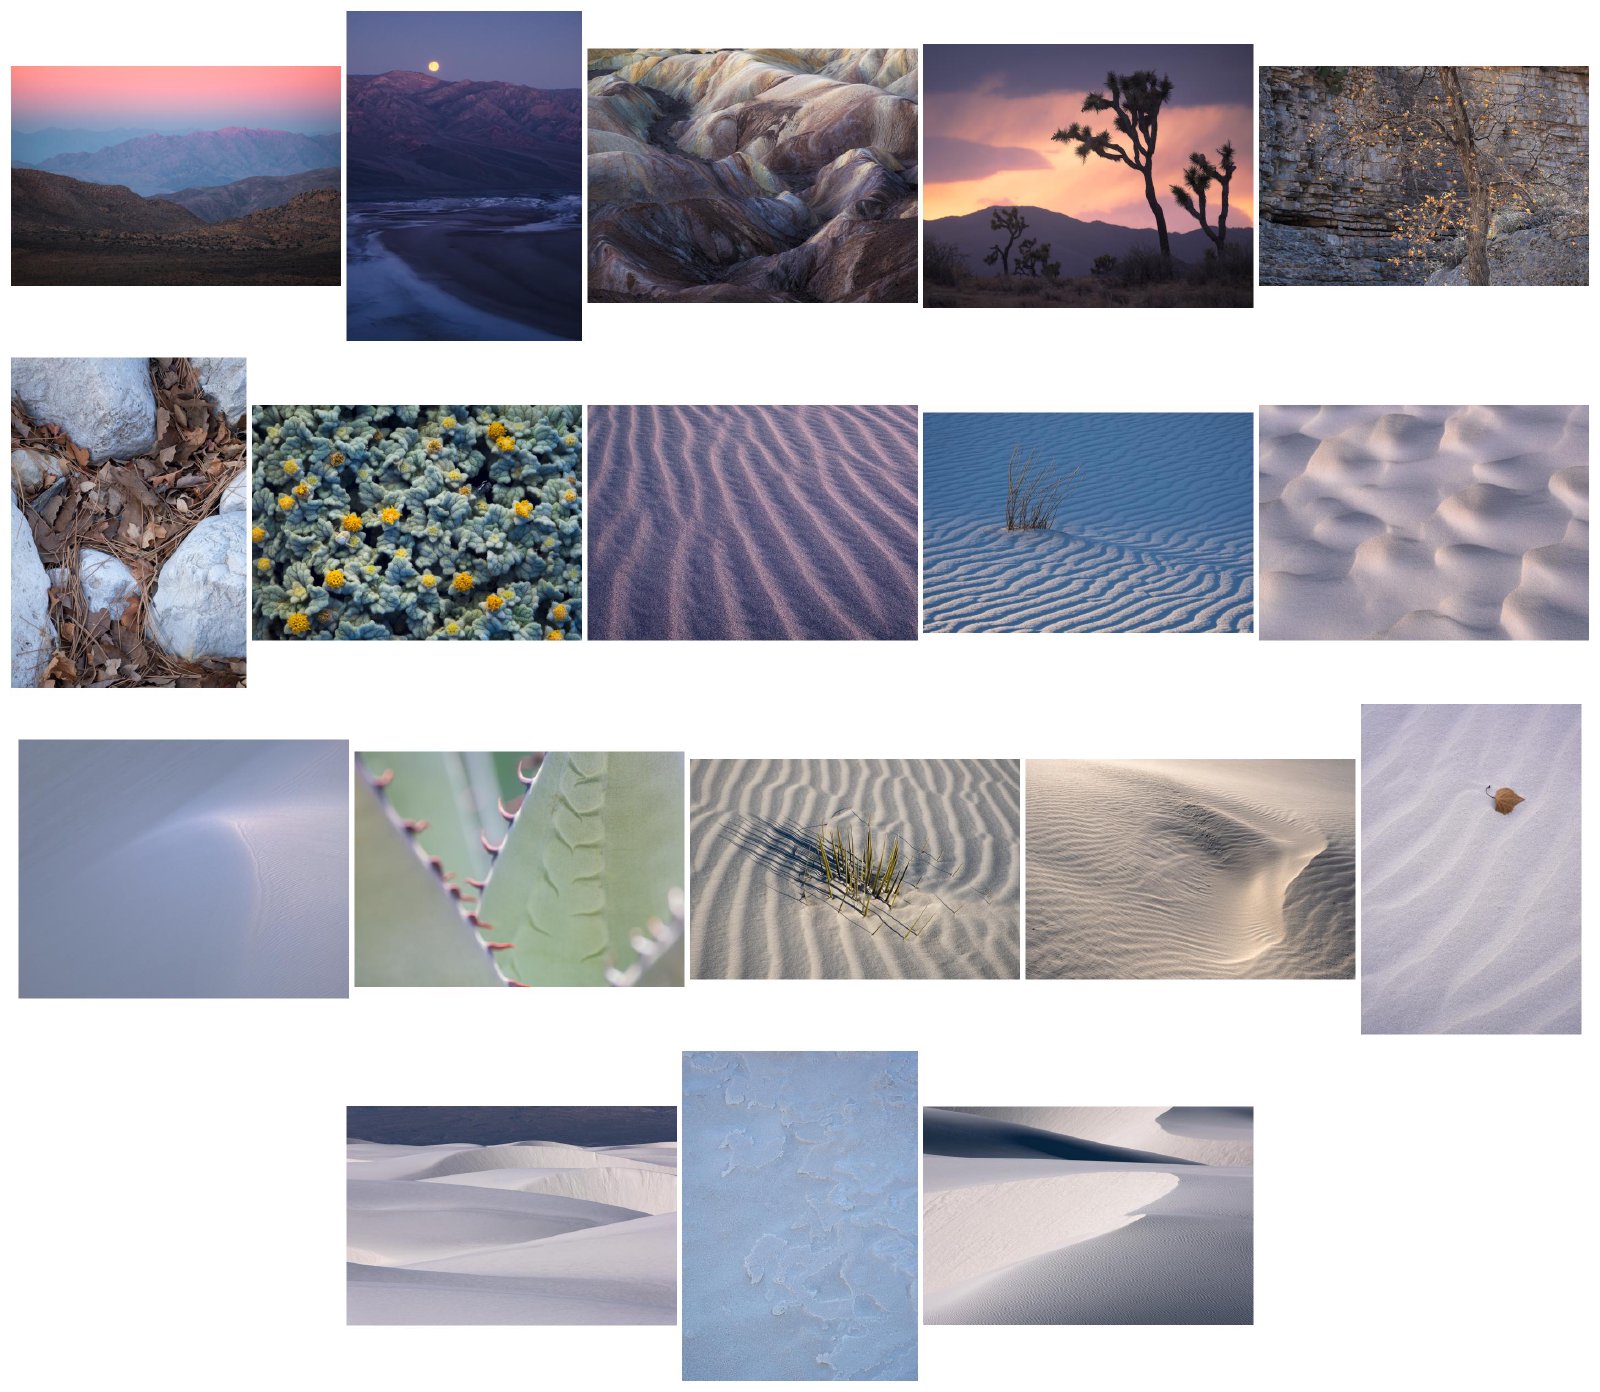

The tutorial that accompanies ColorTools includes 17 examples of how it can be used, including numerous example output graphics (which start in Example 3).
Using ColorTools#
At present, ColorTools is only a Python package and command-line utility. In other words, you can use it from within a Python script, or directly from a command-line application. There is no graphical user interface (GUI).
That said, you don’t actually need to write any code to use it; you simply need to have Python installed on your computer, install it via pip, and be comfortable enough with a command prompt to give it a try!
What’s Next?#
I plan to continue working on ColorTools as my free time allows. There are a number of ways that it could be expanded and improved upon:
The k-selection (or n-selection…) heuristics are fairly rudimentary and could be further researched, tested, and expanded upon.
I recently read (on Wikipedia) that clustering methods generally yield better color quantization results on images if they are first transformed to the the L*a*b* color space, which “was intended as a perceptually uniform space.” This seems like a promising way to improve the quality of the main color extraction algorithm used in ColorTools.
A graphical user interface (GUI) would be nice! I am not much of a front-end developer, which is why I haven’t built a dedicated user interface for ColorTools. I’d love to enable more people to use this tool, but if I’m being honest, this is one upgrade that I’m not overly eager to pursue…
Final Words#
Thanks for reading! Please don’t hesitate to reach out via email or on social media if you have any questions about ColorTools.
Oh, and if you’ve gotten this far and happen to be looking for an open source software project to contribute to, I encourage you to take a stab at any of the features in the section above (or others!) and submit a pull request for your contributions on GitHub!